Predict, Monitor, Profile: A Framework for HPC & MLSys Performance Analysis
A review and guide to the evolution of performance analysis tools, from methodologies to simulators and profilers. Work in progress:)
Your LLM inference is too slow. Your distributed training job isn’t scaling. You’ve thrown more GPUs at the problem, but costs are spiraling and performance gains are minimal. Where is the bottleneck? Is it the code, the compiler, the network, or the hardware itself? Answering these questions requires more than guesswork—it requires a systematic approach to performance analysis.
The landscape of performance analysis tools has undergone remarkable transformation over the decades, evolving from rudimentary profilers to sophisticated, ML-aware frameworks. This post explores performance analysis through a three-phase lens: Pre-Execution (modeling and prediction), During Execution (real-time monitoring), and Post-Execution (profiling and debugging). We trace this evolution from the foundational HPC profilers to today’s specialized ML performance ecosystems.

Why This Framework Matters: Whether you’re a compiler engineer optimizing kernel performance, an infrastructure engineer scaling distributed training, or an ML scientist deploying LLMs to production, understanding when and how to apply these tools can dramatically reduce debugging time and improve system efficiency. This three-phase approach helps you choose the right tool for your specific performance challenge—from predicting bottlenecks before they occur to diagnosing complex distributed training failures.
Pre-Execution: Modeling and Prediction
Performance analysis before running an ML workload – predicting how fast it will run or how an optimization will affect runtime – is incredibly valuable. This phase encompasses analytical modeling, trace-driven simulation, and benchmark generation.
Analytical Models
In the era of supercomputers, researchers built simple performance models to estimate runtime and scalability without executing full experiments. As distributed-memory parallel architectures proliferated in the 1990s, inter-node communication emerged as a critical bottleneck. The LogP Model (1993)
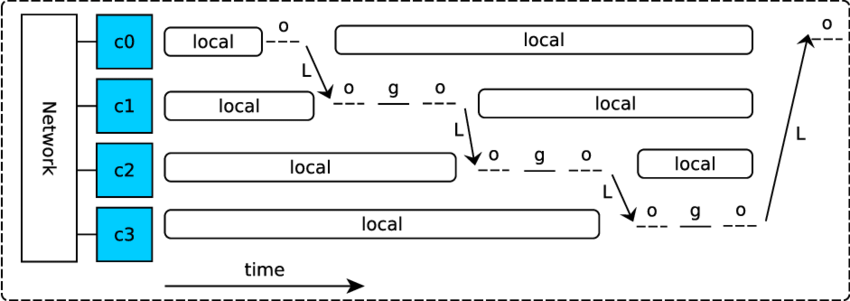
The Roofline Model (2009)
This simple visual model is not perfect, yet it offers insights on the causes of performance bottlenecks. The assumption behind the model is that applications don’t fit in on-chip caches, so they are either computation-limited or memory bandwidth-limited.
The approach proved so valuable that it spawned numerous extensions: the Cache-aware Roofline Model (2013)
More recently, Amped (2023)
Performance Modeling for Deep Learning
Modern performance modeling for deep learning considers the entire distributed training process. Recent surveys analyze simulators across three dimensions: workload representation, the simulation infrastructure itself, and models for Total Cost of Ownership (TCO) that include carbon emissions. These studies compare how different frameworks abstract workloads and detail their underlying assumptions and capabilities.
Workload Representation
A critical aspect of simulation is how DNN workloads are represented, which directly impacts accuracy, performance, and scalability. Workload representations are broadly classified into configuration-based and operator/layer-level Intermediate Representations (IRs). There has been a clear trend away from high-level configuration-based descriptions toward more detailed operator-level IRs, as they provide the fidelity needed to model fine-grained behaviors like scheduling and communication overlap, and specific operator optimizations. These IRs can be either framework-specific (e.g., PyTorch’s Torch.fx) or framework-agnostic (e.g., ONNX, StableHLO, Chakra). While many simulators use custom IRs, Torch.fx is a popular choice due to its tight integration with PyTorch’s profiling infrastructure.
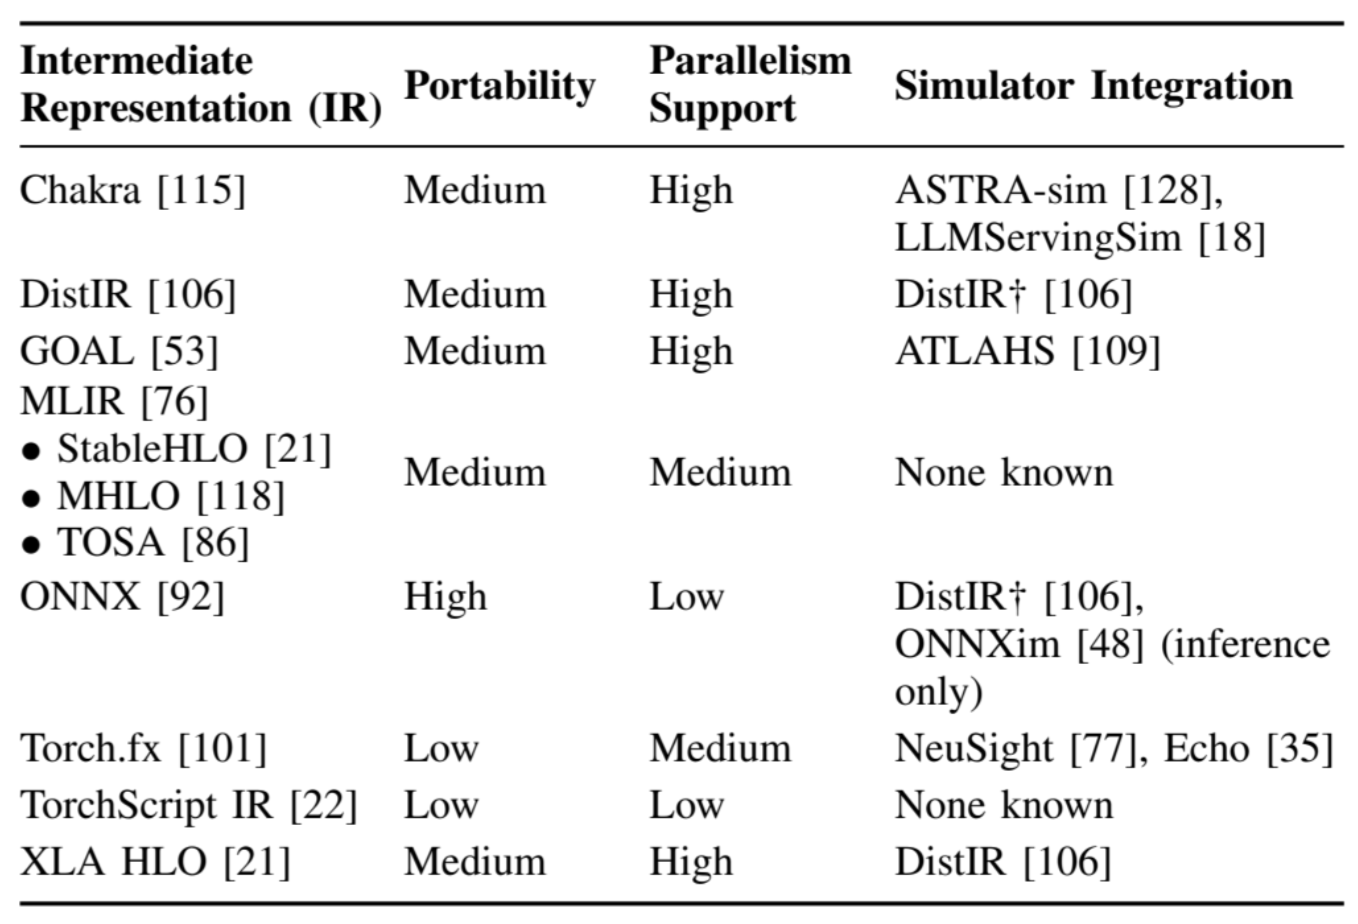
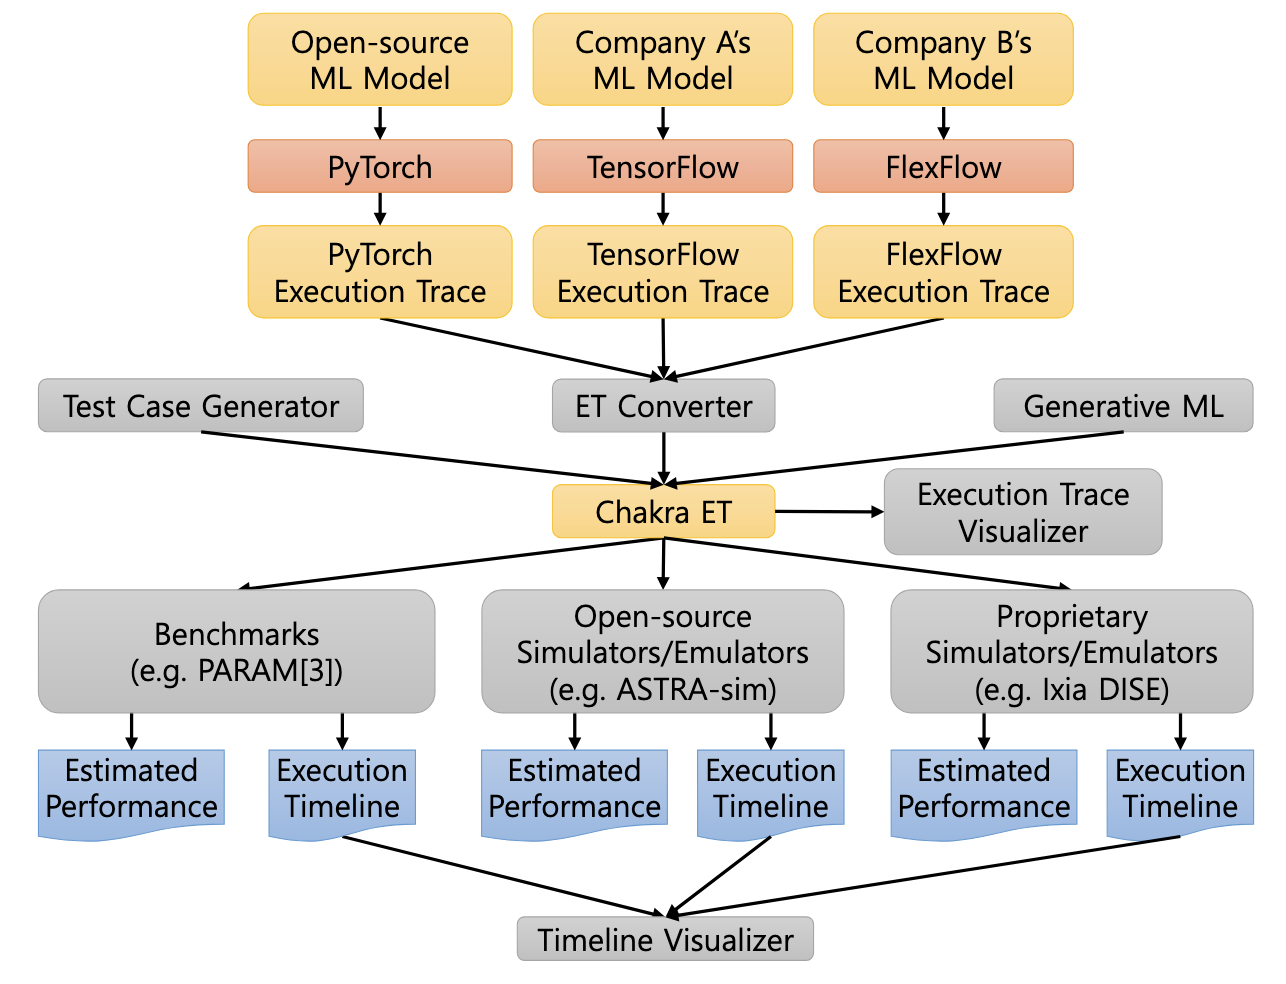
Chakra (2023)
Distributed DNN Training Simulators
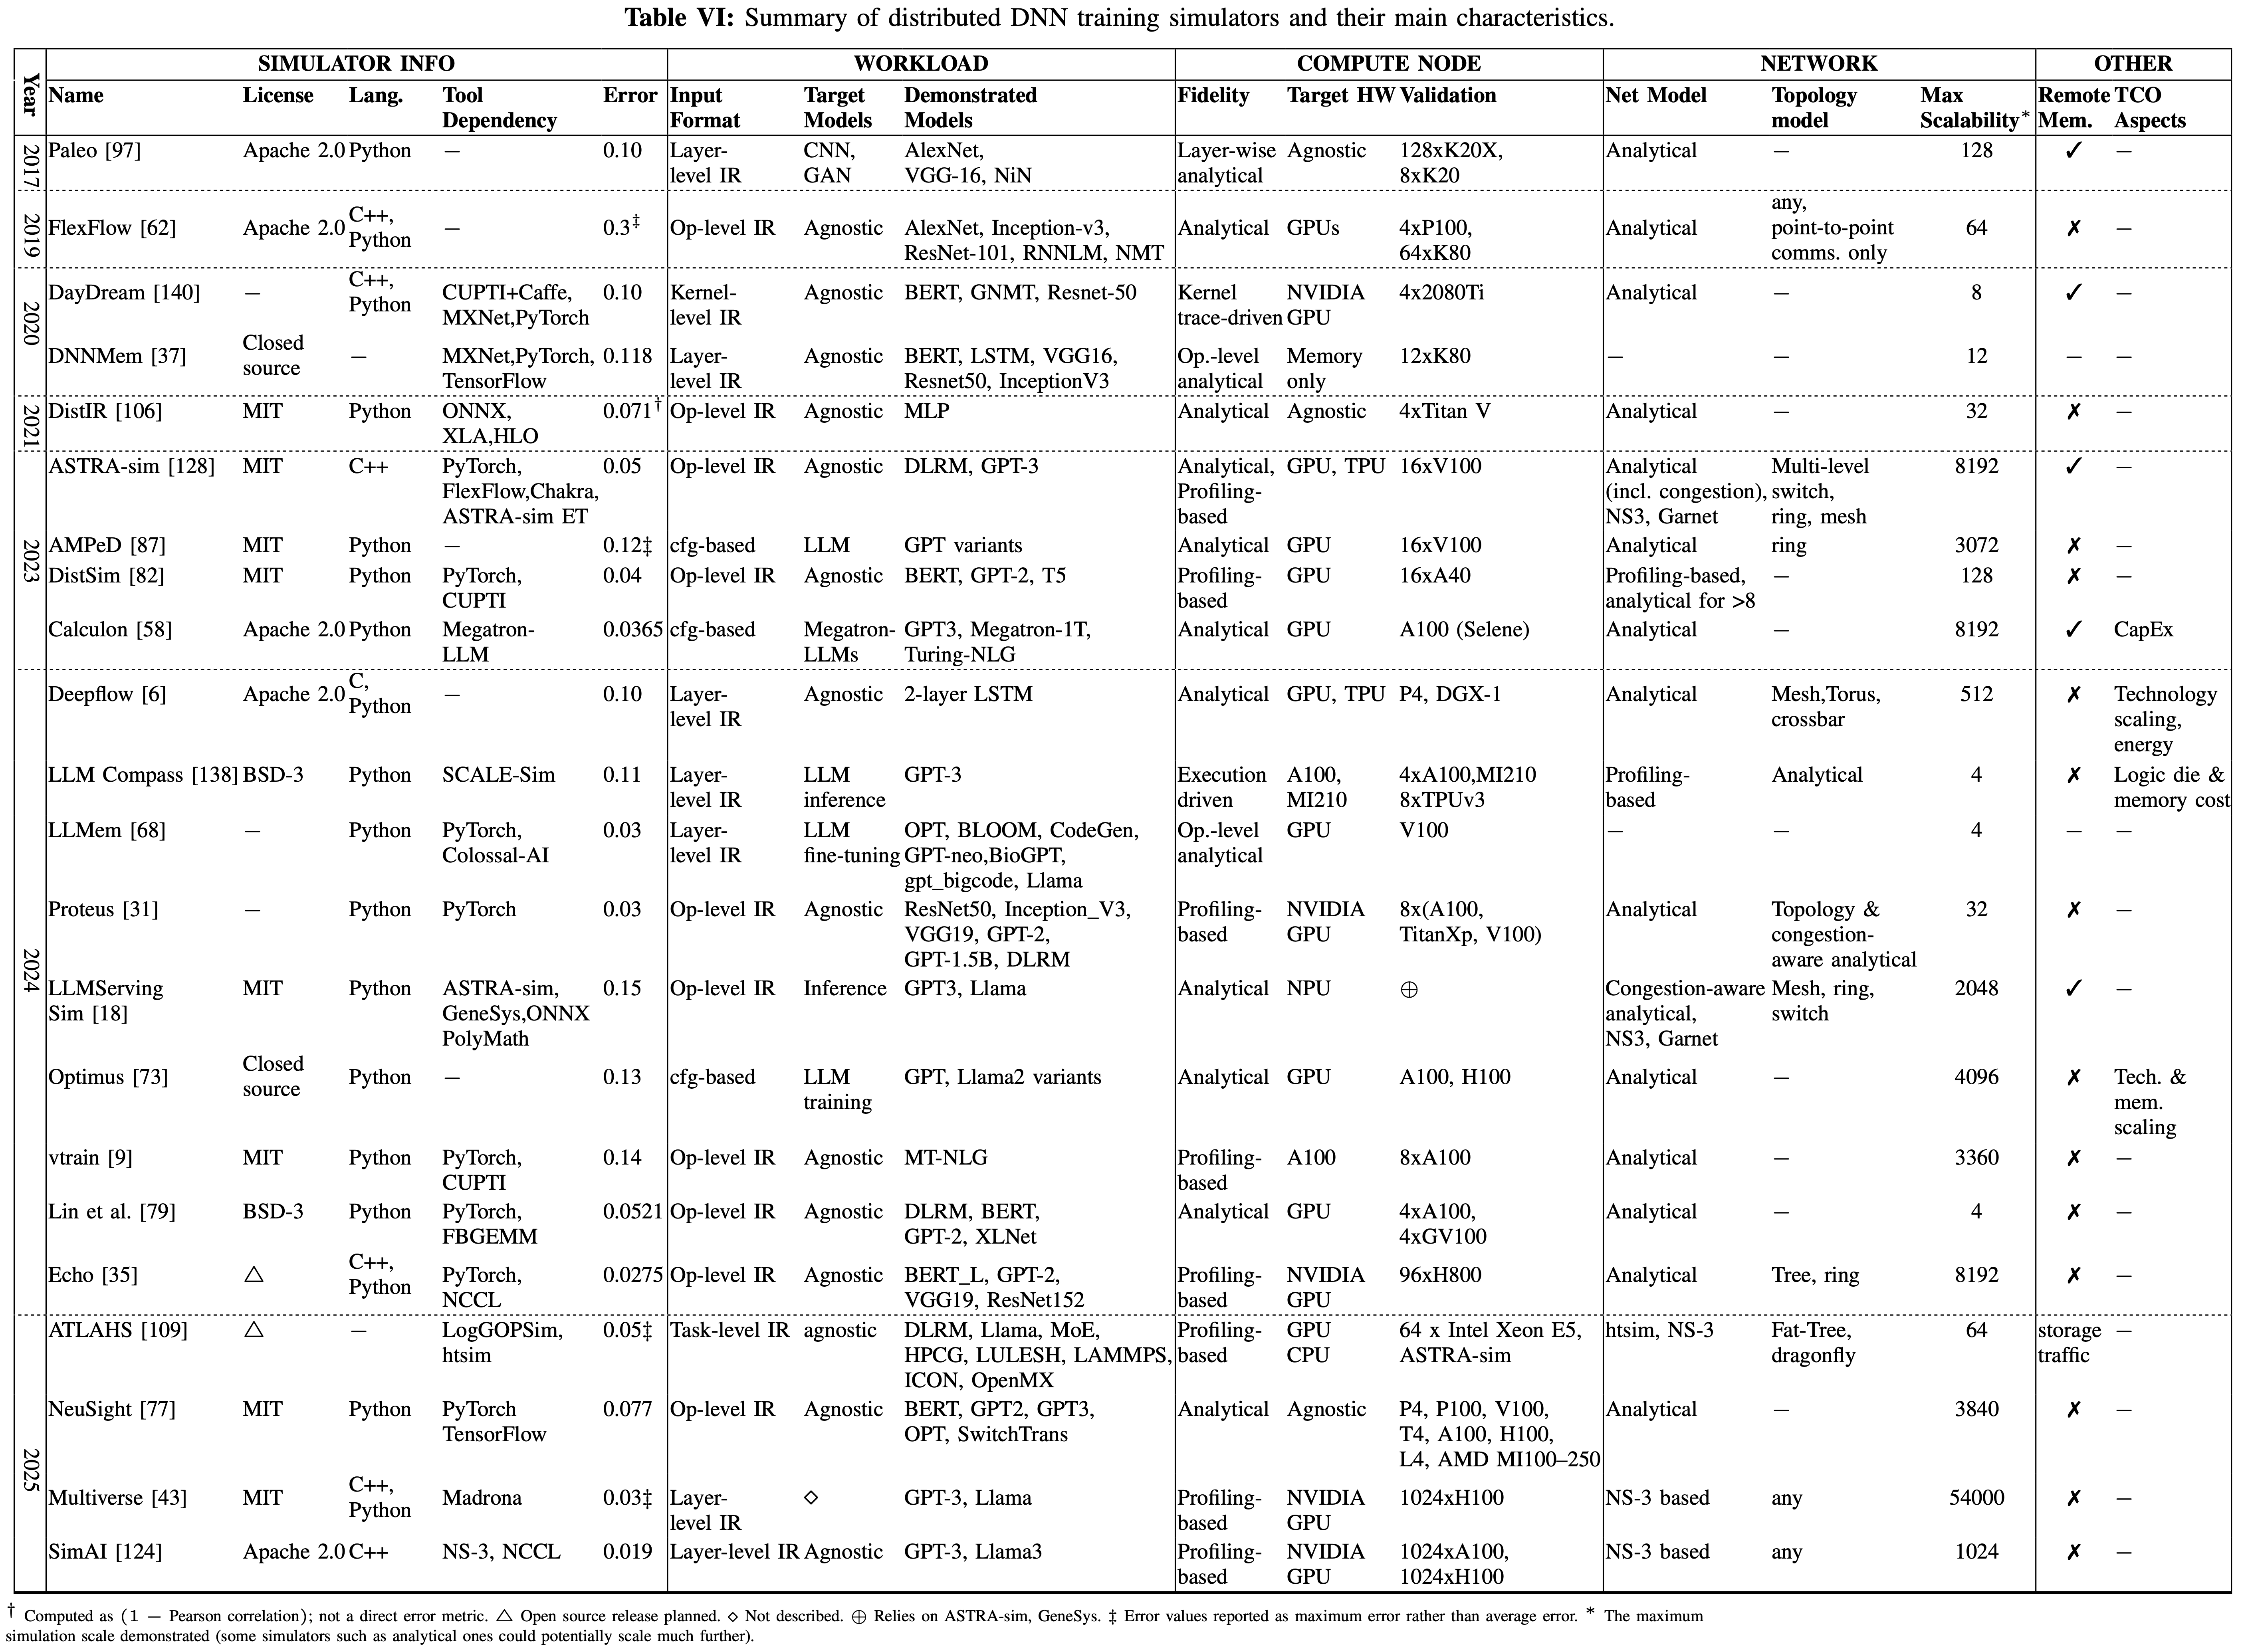
Simulators for distributed DNN training are essential for exploring the vast design space of modern hardware and software systems without the prohibitive cost of physical prototyping. These simulators can be categorized by their core methodology into three main types: analytical, profiling-based, and execution-driven, each offering a different trade-off between speed, fidelity, and scalability.
- Analytical simulators (e.g., Paleo, Calculon) use mathematical models for rapid, though less precise, performance estimation.
- Profiling-based simulators (e.g., ASTRA-sim, SimAI) balance fidelity and speed by using empirical data from real hardware to calibrate analytical models. This has become an increasingly popular approach.
- Execution-driven simulators (e.g., LLMCompass) provide the highest precision by modeling hardware at a micro-architectural level, but this comes at a high cost to simulation speed and scalability.
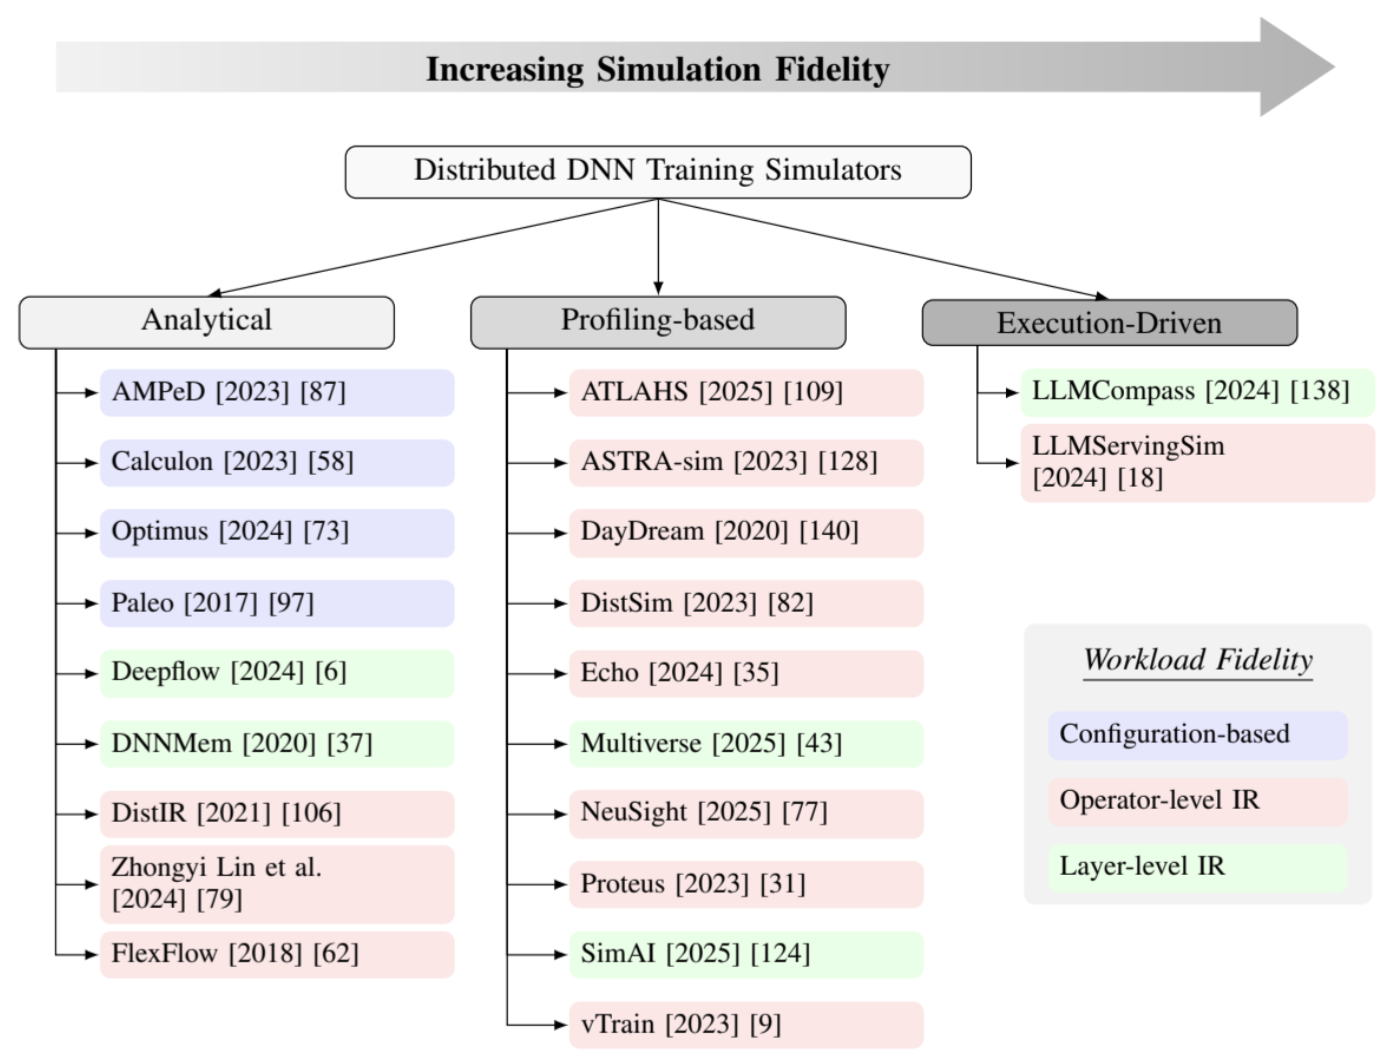
The landscape of distributed DNN training simulators is diverse, with tools employing different methodologies to balance prediction accuracy, simulation speed, and the level of system detail they model. These simulators are crucial for researchers and engineers to explore design spaces, evaluate new hardware, and optimize training strategies without the need for extensive real-world experimentation. To provide a clearer comparative overview, the following figure summarizes key characteristics of prominent simulators in this domain, drawing from recent surveys:
Benchmarking and Workload Generation
Standardized benchmarks are crucial for fair, reproducible performance comparisons across diverse hardware and software stacks.
-
Mystique (ISCA '23)
: Generates miniature, representative benchmarks from production traces, enabling performance testing and analysis on representative workloads without exposing proprietary models or requiring access to full-scale production systems -
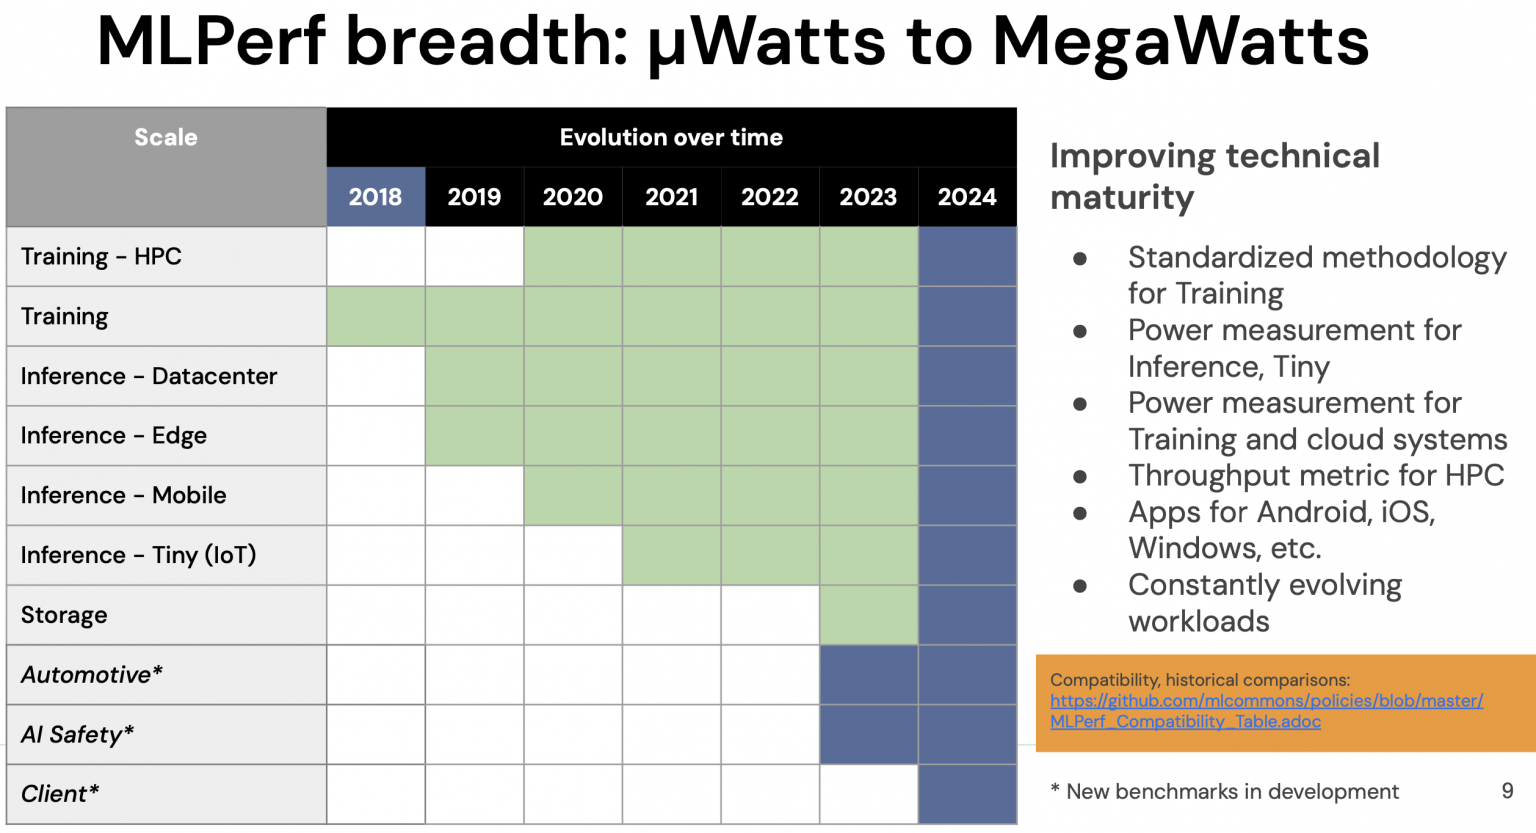
MLPerf (MLSys '20, ISCA '20)
: The industry standard for architecture-neutral training and inference benchmarks, covering domains from datacenter to edge. (Training, Inference)
-
ByteMLPerf: A production-oriented benchmark suite that evaluates performance, accuracy, and software/hardware usability, with a focus on compiler coverage
-
PARAM: Provides parametrized benchmarks for recommendation and AI models, complementing MLPerf with detailed micro-benchmarks for communication and compute analysis
Research in Performance Modeling
2025:
-
NeuSight (ASPLOS '25)
: Data-driven approach for forecasting deep learning performance on GPUs -
Lumos (MLSys '25)
focuses on large-scale LLM training performance, achieving ~3.3% average error on up to 512 NVIDIA H100 GPUs and can estimate performance for new configurations by intelligently modifying and replaying existing execution traces -
TrioSim (ISCA '25)
: A lightweight simulator for large-scale DNN workloads on multi-GPU systems -
SimAI (NSDI '25)
is a profiling-based simulator validated on a 1024-node A100 GPU cluster, notable for its detailed network simulation at scale -
Multiverse (NSDI '25)
: GPU-based parallel simulator for large-scale LLM training design space exploration, achieving <3% error and up to 73.2× speedup on clusters with 54,000+ GPUs -
LLM Performance Prediction (AI4Sys Workshop @ HPDC '25)
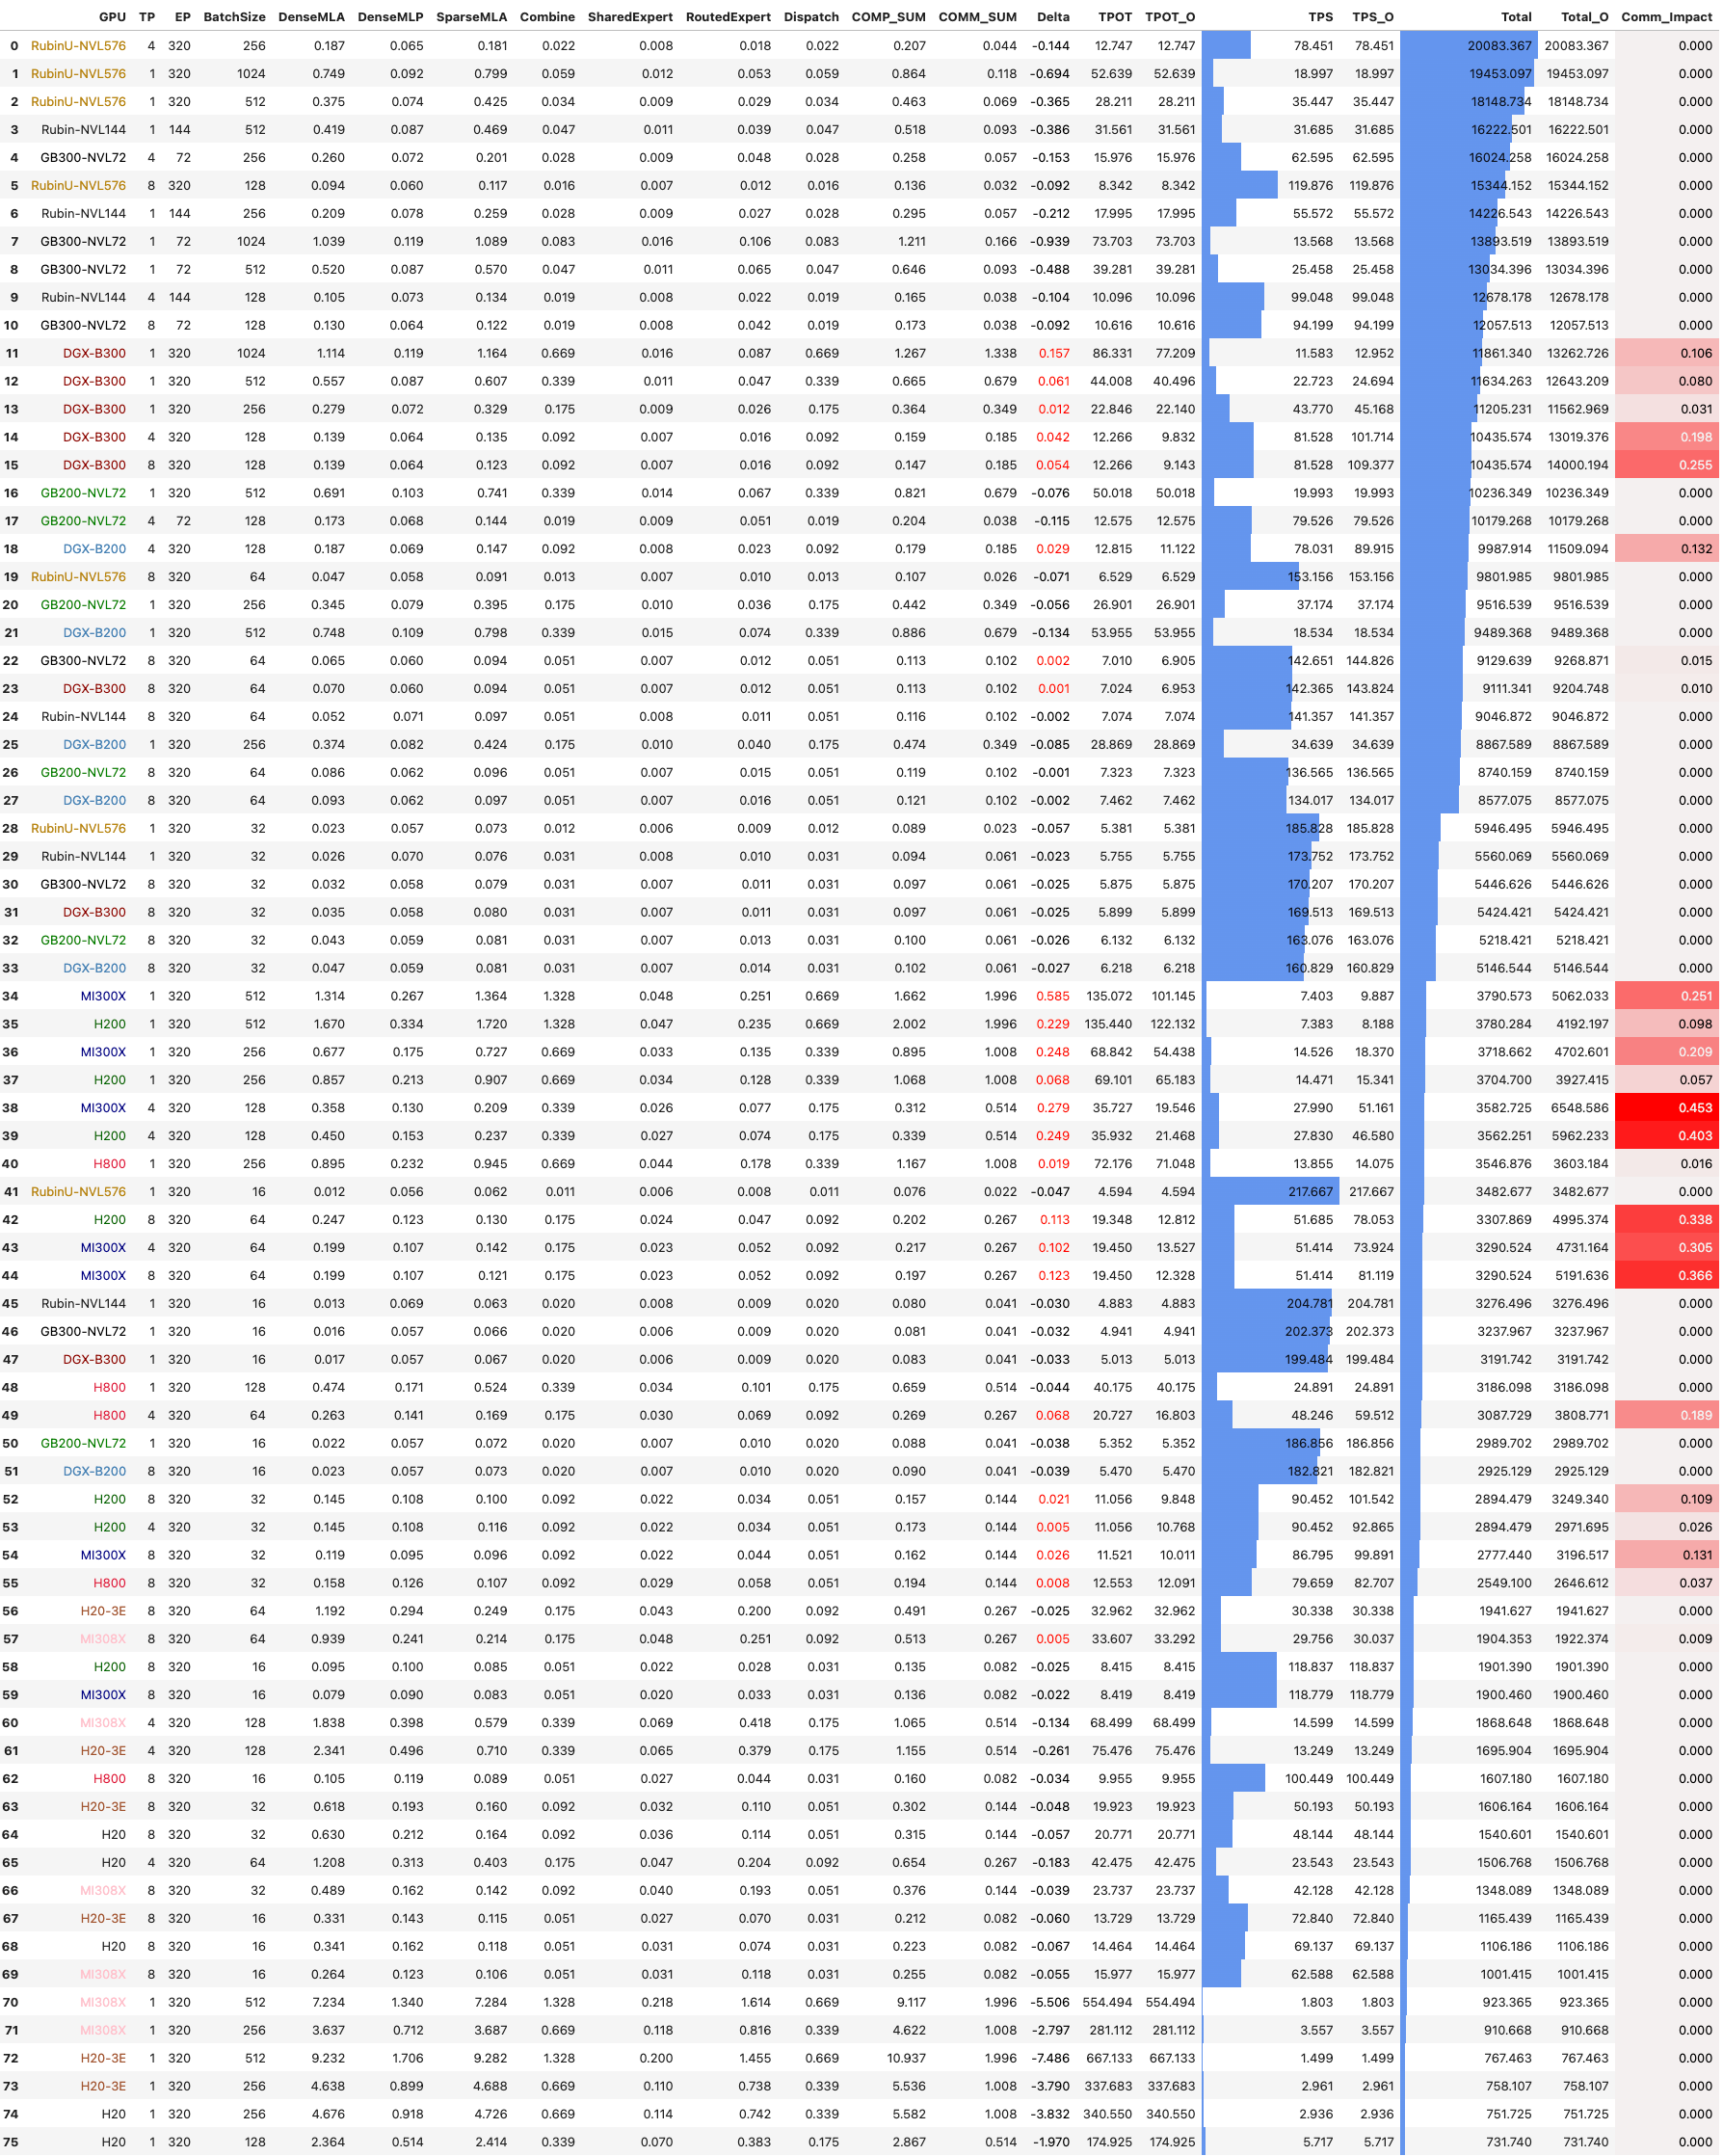
: Investigating whether large language models can predict parallel code performance - shallowsim (GitHub): A specialized inference performance simulator for DeepSeek-V3/R1 models that exemplifies the practical value of pre-execution analysis. Rather than simply providing benchmark numbers, shallowsim generates comprehensive performance rankings that guide critical infrastructure decisions
2024:
-
TraceSim (MLArchSys '24)
improves accuracy for large-scale training by explicitly modeling concurrent streams and inter-thread dependencies. It can predict performance for scaled-up scenarios with high accuracy -
Proteus (TPDS '24)
: Simulates the performance of distributed DNN training with a focus on communication patterns -
Centimani (ATC '24)
: Performance predictor for rapid AI accelerator selection in DNN training -
Vidur (MLSys '24)
: A large-scale simulation framework specifically designed for LLM inference workloads -
LLMServingSim (IISWC '24)
: HW/SW co-simulation infrastructure for LLM inference serving at scale, included in recent surveys for its architectural strengths and potential for extension to training -
LLM Performance Modeling (IISWC '24)
: Performance modeling and workload analysis of distributed large language model training and inference
2022-2023:
-
dPRO (MLSys '22)
constructs a global dataflow graph from operation-level traces to estimate training performance and guide optimizations for distributed training -
ASTRA-sim (ISPASS '20, '23)
: An influential, modular framework that can be extended with external compute, network, and memory models. Its 2.0 version added support for hierarchical networks, disaggregated systems, and improved trace-based simulation capabilities
2020:
-
Daydream (ATC '20)
pioneered this approach by building fine-grained dependency graphs using NVIDIA’s CUPTI. By applying graph transformations that emulate optimizations, Daydream can simulate training runtime with those optimizations applied
But models are never perfect. To validate these predictions and uncover unexpected bottlenecks, we need to observe the system as it runs, which brings us to real-time analysis.
During Execution: Real-Time Analysis
The second phase of our framework focuses on real-time monitoring and on-the-fly adaptations to catch performance issues as they occur. This phase bridges prediction and post-mortem analysis by providing immediate visibility into system behavior.
This capability is powered by low-overhead technologies. eBPF allows for non-intrusive tracing of kernel and API interactions, while vendor suites like NVIDIA's DCGM expose critical hardware counters.
-
eGPU (2025)
: Extending eBPF programmability and observability to GPUs - GPUprobe (2024): Uses eBPF to provide zero-instrumentation CUDA monitoring Blog post
-
PrecisionProbe (2024)
: Non-intrusive performance analysis tool specifically designed for DLRM, providing real-time monitoring capabilities - Variorum (LLNL, 2018+): Vendor-neutral library for exposing power and performance monitoring and control interfaces across diverse architectures (AMD, ARM, IBM, Intel, NVIDIA) Docs
- Dynolog (Meta, 2022+) - A fleet-wide continuous profiling agent for production-scale monitoring
- nvitop (2021+) - A popular, htop-like command-line dashboard for real-time GPU monitoring
- DCGM (Data Center GPU Manager) - NVIDIA’s enterprise suite for managing and monitoring GPUs in cluster environments
While essential for live monitoring, deep diagnosis requires the comprehensive data gathered in post-execution profiling.
Post-Execution: Profiling and Debugging
The third phase of our framework—post-mortem profiling—provides the most detailed insights through offline analysis of execution data. While sampling profilers offer low-overhead glimpses into average performance, they often miss tail latency issues and complex interactions. Tracing methodologies capture comprehensive event logs, enabling a deeper understanding of system behavior and root causes that sampling might miss—a distinction well-articulated in Dan Luu’s Sampling vs. Tracing.
The Early Days
-
prof (1979)
: Unix profiler for CPU and memory usage -
gprof (1982)
: Early portable profiler producing human-readable reports and call graphs -
ProfileMe (MICRO '97)
: Instruction-level sampling to accurately attribute performance incidents (cache misses, latencies) to specific instructions on out-of-order processors, enabling precise bottleneck identification through paired sampling analysis
HPC Profilers
Historic Foundation Tools:
-
HPCToolkit (2000s-present)
: Performance analysis suite using sampling and hardware counters without requiring source modifications, with recent extensions for GPU-accelerated applications. -
TAU (2006-present, IJHPCA '25)
: Portable profiling and tracing toolkit emphasizing flexibility across programming models, now extended to support modern ML frameworks. - Other influential tools from this era include Score-P
(a measurement infrastructure), Vampir (trace visualization), and Scalasca (large-scale parallel performance analysis)
These tools established core principles: use sampling to reduce overhead, incorporate hardware counters, and support hierarchical analysis.
Modern CPU Profilers
System Profilers:
-
Linux:
perf(2009+), Perfetto, DTrace, bpftrace - high-level tracing language using eBPF, inspired by DTrace -
Memory/Debug: Valgrind (2000+)
, gperftools - Visualization & Analysis: pprof - Google’s tool for visualization and analysis of profiling data in protocol buffer format
- Binary Instrumentation: Dyninst - dynamic binary instrumentation framework for runtime program analysis and modification
- Stack Unwinding: libunwind - portable C API for determining call-chains across multiple architectures
- Vendor: Intel VTune (1990s+), AMD uProf (2010s+)
- Classic: gprof/gprofng (ng = next generation)
Python Profilers:
- cProfile/profile: Python’s built-in deterministic profiling tools
- line_profiler: Line-by-line profiling
- VizTracer: Visual trace generation
Continuous Profiling:
- Parca: CPU and memory usage over time
- Foundational work on continuous profiling by Anderson et al. (1997)
and Google’s wide-profiling infrastructure (2010) established the field.
Profiling for GPUs and AI Frameworks
GPU Profilers by Vendor:
- NVIDIA: Nsight Systems (timeline), Nsight Compute (kernel analysis), NVIDIA CUPTI (2009+) / CUPTI Python bindings (API)
- AMD: rocprofiler-sdk (new infrastructure), rocprofiler-compute, ROCtracer, GPU Performance API (analyze performance and execution characteristics), Radeon GPU Profiler (RGP, analyze performance and execution characteristics)
- Intel GPA: Intel Graphics Performance Analyzers
- Graphcore: IPU Tools - PopVision analyzers providing tile-level granularity
ML Framework Profilers:
-
JAX: JAX Profiling - builds on high-level tracing
- PyTorch: The official Profiler uses Kineto as its backend for trace collection and can be analyzed with the Holistic Trace Analysis (HTA) (GitHub) library.
- Ray: Comprehensive profiling suite with native Dashboard integration for CPU (py-spy), memory (memray), GPU (PyTorch Profiler, Nsight System), and Ray Task/Actor timeline profiling
- Triton: Triton Proton (2024), TritonParse (2025)
- TensorFlow: Profiler (GitHub) via TensorBoard
- DeepSpeed: Flops Profiler for FLOPS counting
- LLM Serving: SGLang Profiling, vLLM Profiling - PyTorch Profiler and Nsight integration
- Specialized: DeepSeek Profile Data, OctoML Profile
Collective Communication:
- NPKit - Unified profiling framework for NCCL, MSCCL, MSCCL++, and RCCL
- ncclsee - Lightweight profiler combining NCCL’s interface and CUPTI, validated on ResNet50 (PyTorch) with <1% overhead Slides
- mpisee
- MPI-Profiler
- mpiP
Production-Scale Systems:
- Strobelight (Meta): 42+ profilers orchestrated via eBPF, continuous profiling at scale
-
Meta’s datacenter analysis
: Fleet-wide GPU utilization insights - Commercial APM: Datadog (continuous profiling, distributed tracing, GPU monitoring)
Visualization Tools:
- TensorBoard: Multi-source event timeline visualization
- Perfetto: System-wide trace visualization merging CPU, GPU, and framework events
- Flame Graphs: Visualization technique for profiled software, allowing quick identification of hot code paths
Research in Post Mortem Analysis
2025:
-
Automatic Tracing in Task-Based Runtime Systems (ASPLOS ‘25)
- Tintin (OSDI '25)
-
Neutrino (OSDI '25)
: Fine-grained GPU kernel profiling via programmable probing (Website, Blog post) -
KPerfIR (OSDI '25)
: Compiler-centric ecosystem for GPU kernel performance tooling on modern AI workloads -
Dilu (ASPLOS '25)
: Enabling GPU resourcing-on-demand for serverless DL serving via introspective elasticity -
hpcanalysis (ICS '25)
: A new approach to analyzing the performance of applications measured with HPCToolkit, with a focus on measurement data from large-scale executions GitLab -
STAD (TPDS '25)
: A performance analysis tool for parallel programs that considers both spatial and temporal patterns within trace data -
SKIP (System-Aware Kernel Inference Profiler) (ISPASS '25)
analyzes LLM inference with fine-grained latency attribution, introducing TKLQT (Total Kernel Launch and Queuing Time) and critical batch size identification -
Shared-Memory Atomic Bottlenecks (GPGPU '25)
: A study on modeling utilization to identify bottlenecks in shared-memory atomic operations -
HPC Task-Dependent Performance (FGCS ‘25)
: Measuring and interpreting performance of HPC applications with dependent tasks -
GPU Utilization Measurement (2025)
: Measuring GPU utilization one level deeper for more accurate performance analysis
2024:
-
DrPy (CGO '24)
: A tool for pinpointing inefficient memory usage in multi-layer Python applications -
EasyView (CGO '24)
: A tool that integrates performance profiles into development environments to enhance debugging and optimization GitHub Zenodo -
Snoopie (ICS '24)
: A multi-GPU communication profiler and visualizer for analyzing distributed GPU workloads GitHub -
bperf and BCOZ (OSDI ‘24)
: A method to identify both on- and off-CPU bottlenecks using blocked samples -
Retrospection (HiPC '24)
: A review of performance analysis tools for large-scale HPC programs -
PRoof (ICPP '24)
: A comprehensive hierarchical profiling framework for deep neural networks that integrates Roofline analysis to provide insights into performance bottlenecks across different system levels -
Orion (EuroSys '24)
: Interference-aware, fine-grained GPU sharing for ML applications -
Scalana (TPDS '24)
: Leveraging graph analysis to pinpoint root causes of scalability issues for parallel applications -
Comparative Profiling (MLSys Workshop '24)
: Insights into latent diffusion model training through comparative profiling -
LLM Serving Simulation (2024)
: Simulation-based approach for identifying optimal parallelism in high-performance LLM serving -
Nanoflow (2024)
: Towards optimal large language model serving throughput -
Sniper (TACO '24)
: Exploiting spatial and temporal sampling for large-scale performance analysis -
DeepContext (2024)
: Context-aware, cross-platform performance analysis for deep learning workloads -
Low-overhead GPU Trace Collection (TOPC '24)
: Low-overhead trace collection and profiling on GPU compute kernels
2023:
-
Propeller (ASPLOS '23)
: A profile-guided, relinking optimizer for warehouse-scale applications GitHub -
Vclinic (ASPLOS '23)
: A portable and efficient framework for fine-grained value profilers -
Drgpum (ASPLOS '23)
: Memory optimization guidance for GPU-accelerated applications -
Scalene (OSDI '23)
: CPU, GPU, and memory profiling GitHub -
GPU Execution Time Prediction (MICRO '23)
: Fast and accurate prediction of GPU execution time for DNN workloads beyond traditional simulators -
TrivialSpy (SC '23)
: Identifying software triviality through fine-grained and dataflow-based value profiling -
Hotline Profiler (MLSys '23)
: Automatic annotation and multi-scale timeline for visualizing time-use in DNN training -
Thicket (HPDC '23)
: Seeing the performance experiment forest for the individual run trees GitHub Tutorial Publications -
Drgpu (ICPE '23)
: Top-down profiler providing systematic guidance from performance issues to root causes -
ML Training Monitoring (MLSys Workshop '23)
: Profiling and monitoring deep learning training tasks -
Torchbench (2023)
: Benchmarking tool for PyTorch that ensures high API surface coverage.
2022:
-
ValueExpert (ASPLOS '22)
: Analyzes value patterns and redundancy in GPU applications to uncover optimization opportunities -
PerFlow (PPoPP '22)
: A domain-specific framework for automatic performance analysis of parallel applications -
GPU Variability Study (SC '22)
: Characterizing variability in large-scale, accelerator-rich systems -
Low Overhead GPU Profiling (ICS '22)
: Low overhead and context sensitive profiling of GPU-accelerated applications -
Hatchet Call Path Querying (e-Science '22)
: Enabling call path querying in hatchet to identify performance bottlenecks in scientific applications -
Amazon SageMaker Profiling (KDD '22)
: Profiling deep learning workloads at scale using Amazon SageMaker
2021:
-
Tiered Memory Profiling (IPDPS '21)
: Techniques for profiling performance on systems with tiered memory architectures. -
GPA (CGO '21)
: A GPU performance advisor based on instruction sampling -
Efficient Python-Native Interactions (ESEC/FSE '21)
: Exploring efficient interactions between Python and native libraries to improve performance
2020:
-
Precision of PEBS (APSys '20)
: An investigation into the precision of Precise Event-Based Sampling. -
XSP (IPDPS '20)
: Across-stack profiling and analysis of machine learning models on GPUs -
DrCCTProf (SC '20)
: A fine-grained call path profiler for arm-based clusters. (Performance Track Best Paper, All Tracks Best Paper nominee) GitHub -
GVProf (SC '20)
: A value profiler designed for GPU-based clusters to enhance performance analysis -
Scalana (SC '20)
: Automating scaling loss detection with graph analysis for parallel applications -
ZeroSpy (SC '20)
: Exploring software inefficiency with redundant zeros to identify optimization opportunities -
GPU Top-Down Analysis (ICS '20)
: Tools for top-down performance analysis of GPU-accelerated applications -
Skyline (UIST '20)
: Interactive in-editor computational performance profiling for deep neural network training -
GPU Computing Tools (2020)
: Debugging and performance analysis tools for heterogeneous HPC applications
2019:
-
Diogenes (SC '19)
: An honest CPU/GPU performance measurement tool -
Hatchet (SC '19)
: Pruning the overgrowth in parallel profiles GitHub Tutorial Notebooks-SC19 -
Nvbit (MICRO '19)
: A dynamic binary instrumentation framework for NVIDIA GPUs -
Cuda Flux (PMBS '19)
: A lightweight instruction profiler for CUDA applications -
CUDABlamer (2019)
: Understanding GPGPU application performance from a data-centric perspective GitHub
2018:
-
Witch (ASPLOS '18)
: Watching for software inefficiencies with specialized monitoring tools -
CudaAdvisor (CGO '18)
: LLVM-based runtime profiling for modern GPUs -
Lost in Abstraction (HPCA '18)
: Pitfalls of analyzing GPUs at the intermediate language level -
Counterminer (MICRO ‘18)
: Mining big performance data from hardware counters
2017:
-
Redspy (ASPLOS '17)
: Exploring value locality in software for performance optimization
2016:
-
AutoFDO (CGO '16)
: Automatic feedback-directed optimization for warehouse-scale applications GitHub -
Caliper (SC '16)
: Performance introspection for HPC software stacks, providing flexible performance measurement and analysis capabilities GitHub -
Flame Graph (CACM '16)
: The foundational flame graph visualization technique for performance analysis -
Wait State Analysis (TOPC '16)
: Identifying the root causes of wait states in large-scale parallel applications -
Advanced Hardware Sampling (2016)
: A technical report on creating a new PAPI interface for advanced hardware profiling features like PEBS and IBS.
2015:
-
Coz (SOSP '15)
: Causal profiling to find code that counts GitHub -
Flexible GPU Profiling (ISCA '15)
: Flexible software profiling techniques for GPU architectures -
GT-Pin (IISWC '15)
: Fast computational GPU design with GPU instrumentation -
Warehouse-scale Profiling (ISCA '15)
: Comprehensive profiling of warehouse-scale computers, characterizing workloads across Google’s entire fleet
2014:
-
Top-Down Performance Analysis (ISPASS '14)
: A method for performance analysis and counters architecture
2012:
-
PAPI Energy Measurement (ICPPW '12)
: Measuring energy and power with PAPI for performance analysis
2011:
-
Anywhere, Anytime Binary Instrumentation (PASTE '11)
: A framework for dynamic binary instrumentation at any point during program execution. -
Bubble-up (MICRO '11)
: Increasing utilization in modern warehouse scale computers via sensible co-locations
2010:
-
AMD Instruction-Based Sampling (ISPASS '10)
: Early work on incorporating IBS into AMD’s CodeAnalyst performance tool. -
HPCToolkit (CPE '10)
: Tools for performance analysis of optimized parallel programs
2007:
-
Stack Trace Analysis (IPDPS '07)
: Large-scale debugging through stack trace analysis techniques
2003:
-
Memory Profiling (SC '03)
: Memory profiling using hardware counters
2002:
-
Dynamic Statistical Profiling (SIGMETRICS '02)
: Dynamic statistical profiling of communication activity in distributed applications
2000:
-
Store Instruction Locality (ISCA '00)
: Analysis of value locality in store instructions
1997:
-
Continuous Profiling (TOCS '97)
: Foundational work on continuous profiling to identify where all the cycles have gone
1996:
-
Exceeding Dataflow Limits (MICRO '96)
: Techniques for exceeding dataflow limits via value prediction -
Value Locality (ASPLOS '96)
: Foundational work on value locality and load value prediction
1995:
-
Paradyn
: An early, influential parallel performance measurement tool that introduced dynamic instrumentation.
The detailed traces from post-mortem analysis don't just solve today's problems. They become the input for building more accurate predictive models for the next generation of workloads, bringing our framework full circle.
Approach Selection Guide
Choosing the right performance analysis approach depends on your specific scenario:
| Scenario | Pre-Execution | During Execution | Post-Execution |
|---|---|---|---|
| New model architecture | Roofline, ASTRA-sim | - | PyTorch Profiler + HTA |
| Distributed training scaling | SimAI, Multiverse | nvitop, Dynolog | Nsight Systems |
| Production LLM serving | Centimani (hardware selection) | nvidia-smi, monitoring | SKIP, Nsight Compute |
| Memory optimization | Analytical models | - | Drgpum, ValueExpert |
| Kernel-level debugging | - | perf top | KPerfIR, Drgpu |
| Cross-platform analysis | Benchmarking (MLPerf, PARAM) | - | HPCToolkit, DeepContext |
Notable PhD Dissertations
This section highlights doctoral dissertations that have made significant contributions to performance analysis:
- Qidong Zhao. "Novel Profiling Techniques for Emerging Architectures and Applications." PhD Dissertation, North Carolina State University, 2025.
- Yueming Hao. "Let GPUs Work Harder: Performance Analysis and Optimization for GPGPU Applications." PhD Dissertation, North Carolina State University, 2024.
- Zhongyi Lin. "Performance Modeling and Optimization for Machine Learning Workloads." PhD Dissertation, University of California, Davis, 2023.
- Hongyu Zhu. "Benchmarking, Profiling and White-Box Performance Modeling for Deep Neural Network Training Workloads." PhD Dissertation, University of Toronto, 2022.
- Keren Zhou. "Performance Measurement, Analysis, and Optimization of GPU-accelerated Applications." PhD Dissertation, Rice University, 2022.
- Pengfei Su. "Understanding Performance Inefficiencies in Native and Managed Languages." PhD Dissertation, The College of William and Mary, 2021.
- Yu (Emma) Wang. "Performance Analysis for Machine Learning Applications." PhD Dissertation, Harvard University, 2019.
- Hui Zhang. "Data-centric Performance Measurement and Mapping for Highly Parallel Programming Models." PhD Dissertation, University of Maryland, College Park, 2018.
- Xu Liu. "Performance Analysis of Program Executions on Modern Parallel Architectures." PhD Dissertation, Rice University, 2014.
Awards and Recognition
SIGHPC Outstanding Doctoral Dissertation Award recognizes doctoral dissertations with HPC as a central research theme, including computational capabilities delivering much higher performance than desktop systems. The award is presented annually at the SC conference.
Further Reading
For readers interested in diving deeper into specific aspects of performance analysis, we recommend the following comprehensive resources:
-
NVLink-C2C Interconnect (ISSCC '23)
: Details on the NVLink-C2C chip-to-chip interconnect, a key technology for modern multi-GPU systems -
Trends in Data Locality Abstractions (TPDS '17)
: A comprehensive overview of data locality abstractions for HPC systems -
GPU-Centric Communication Survey (2024)
: Comprehensive analysis of the landscape of GPU-centric communication patterns and optimization strategies -
Survey on Distributed Training Optimization:
Provides an extensive survey on efficient training of large language models on distributed infrastructures, covering optimization techniques, communication strategies, and system design considerations -
Centauri (ASPLOS '24):
A novel approach for enabling efficient scheduling and communication-computation overlap in large model training through communication partitioning techniques -
Hidden Performance Opportunities (2018)
: Exposing hidden performance opportunities in high-performance GPU applications -
Data Locality in Post-Exascale Era (CSE '25)
: Analysis of persistent challenges in data locality for emerging computing paradigms -
Understanding Data Movement in Tightly Coupled Heterogeneous Systems (2024)
: Understanding data movement in tightly coupled heterogeneous systems: A case study with the Grace Hopper superchip - Advanced Stack Unwinding in C Using libunwind for HPC Debug Tools
- Playing with AMD IBS
- Understanding the Performance of Ultrascale Systems with Performance Counters by Jeffrey Vetter
Conclusion: From Guesswork to a Science
The journey from a slow, inefficient ML system to a highly optimized one is no longer an art form defined by guesswork. By adopting a structured, three-phase approach—Predicting bottlenecks before they occur, Monitoring systems in real-time, and Profiling for deep insights—engineers and scientists can systematically dismantle performance mysteries. Whether you are designing the next generation of hardware or deploying a model to millions of users, this framework provides a map for navigating the complex landscape of modern HPC and ML performance. The right tool exists for your challenge; the key is knowing when and how to use it.